Enzymatic preparation of casein hydrolysates with high digestibility and low bitterness studied by peptidomics and random forests analysis
相关推荐
-
Thermodynamic binding properties of a novel umami octapeptide K1 ADEDSLA8 and its mutational variants p.A2G, p.D5E, and p.A2G + p.D5E (BMP) in complex with the umami receptor hT1R1/hT1R3
 2025-08-26 20
 -
Enhancing storage stability of pea peptides through encapsulation in maltodextrin and gum tragacanth via monitoring scavenge ability to free radicals
 2025-09-02 14
 -
A novel peptide from Garden pea proteins activates AMP-activated protein kinase and enhances glucose uptake in C2C12 myotubes

 2025-09-15 21
 -
Accurate quantification of small bioactive peptides derived from dairy and plant-based beverages using isotope-coded dimethyl labeling and LC-MS/MS
 2025-11-22 7
 -
Preparation and Characterization of Ultrasound‑Assisted Novel Peptide–Calcium Chelates from Nannocholoropsis oceanica

 2025-11-24 5
 -
Plant-based protein amyloid fibrils Origins, formation, extraction, applications, and safety
 2025-11-25 4
 -
Impact of drying techniques on the physicochemical, structural, thermal, techno-functional, rheological properties, and in vitro digestibility of sesame protein isolate
 2025-11-26 11
 -
Whey protein isolate and inulin-glycosylated conjugateaffect the physicochemical properties and oxidative stabilityof pomegranate seed oil emulsion
 2025-11-27 4
 -
Research Progress in Saltiness Perception and Salty Substitutes
 2025-11-28 5
 -
Rice protein-derived hypoglycemic peptides IQP,VEP and IPQ alleviate obesity-related metabolic disorders in high-fat diet (HFD)-induced C57BL 6J mice through activation of AMPK and modulation
 2025-11-29 5
作者详情
-
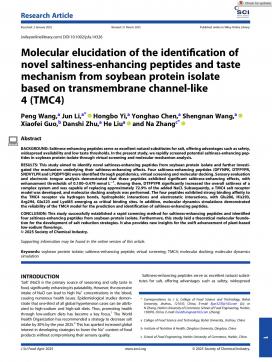
Molecular elucidation of the identification of novel saltiness-enhancing peptides and taste mechanism from soybean protein isolate based on transmembrane channel-like 4 (TMC4)1 知币4人下载
-
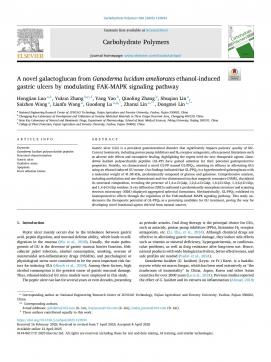
A novel galactoglucan from Ganoderma lucidum ameliorates ethanol-induced gastric ulcers by modulating FAK-MAPK signaling pathway1 知币4人下载
相关内容
-

Preparation and Characterization of Ultrasound‑Assisted Novel Peptide–Calcium Chelates from Nannocholoropsis oceanica
分类:文献
时间:2025-11-24
标签:无
格式:PDF
价格:1 知币
-

Plant-based protein amyloid fibrils Origins, formation, extraction, applications, and safety
分类:文献
时间:2025-11-25
标签:无
格式:PDF
价格:1 知币
-

Impact of drying techniques on the physicochemical, structural, thermal, techno-functional, rheological properties, and in vitro digestibility of sesame protein isolate
分类:文献
时间:2025-11-26
标签:无
格式:PDF
价格:1 知币
-

Whey protein isolate and inulin-glycosylated conjugateaffect the physicochemical properties and oxidative stabilityof pomegranate seed oil emulsion
分类:文献
时间:2025-11-27
标签:无
格式:PDF
价格:1 知币
-

Research Progress in Saltiness Perception and Salty Substitutes
分类:文献
时间:2025-11-28
标签:无
格式:PDF
价格:1 知币


